jzy3d - improper grid lines on Windows 7 when drawing a shape to a canvas of a chart

classic Classic list List threaded Threaded
4 messages Options
Reply | Threaded
Open this post in threaded view
|

jzy3d - improper grid lines on Windows 7 when drawing a shape to a canvas of a chart

gem24
HI,

I am using jzy3d library for drawubg 2d and 3d models.

private Shape getSurface(double[][] plotValues, int steps) {
                // Create the object to represent the function over the given range.

                ArrayList<Variable> selectedVars = surrogateModel
                                .getSelectedVariables();
                Variable selectedVar1 = selectedVars.get(0);
                Variable selectedVar2 = selectedVars.get(1);
                Range range1 = new Range(selectedVar1.getMinRange(),
                                selectedVar1.getMaxRange());
                Range range2 = new Range(selectedVar2.getMinRange(),
                                selectedVar2.getMaxRange());

                // final Shape surface
                final Shape surface = (Shape) ExtendedBuilder.buildOrthonormal(
                                new ExtendedOrthonormalGrid(range1, steps, range2, steps),
                                plotValues);
                surface.setColorMapper(new ColorMapper(new ColorMapRainbow(), surface
                                .getBounds().getZmin(), surface.getBounds().getZmax(),
                                new Color(1, 1, 1, 1f)));

                surface.setWireframeDisplayed(true); // sets/unsets the black

                // gridlines on the plot
                if (surface.getWireframeDisplayed())
                        surface.setWireframeColor(Color.BLACK);

                if (selectedVars != null) {
                        String xLabel = selectedVar1.getName();
                        String yLabel = selectedVar2.getName();
                        String zLabel = surrogateModel.getSelectedResponse().getName();
                        setAxeLabels(chart1, xLabel, yLabel, zLabel);
                        setAxeLabels(chart2, xLabel, yLabel, zLabel);
                }

                IAxeLayout layout = chart1.getView().getAxe().getLayout();
                colorbar = new Colorbar(surface, layout);
                surface.setLegend(colorbar);
                return surface;
        }


                predShape = getSurface(plotValues, steps);
                predShape.setLegendDisplayed(false);
                chart1.getScene().getGraph().add(predShape, false);

         component1 = (Component) chart1.getCanvas();
                component1.repaint();


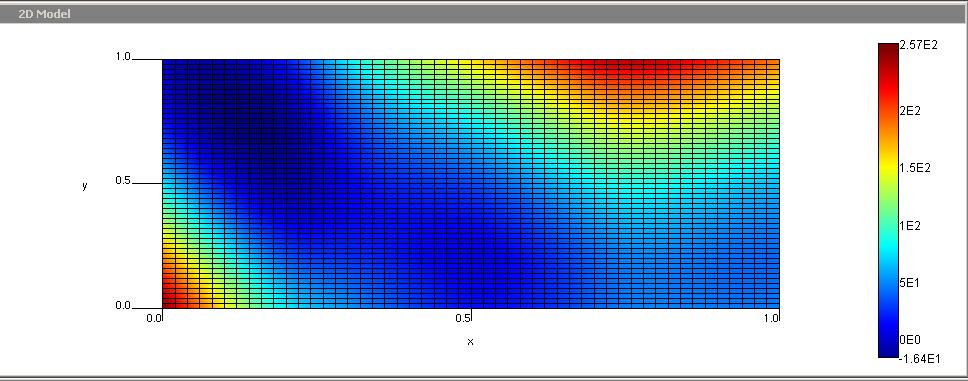
I am adding this surface to my canvas.

The grid lines appear fine on Windows XP.

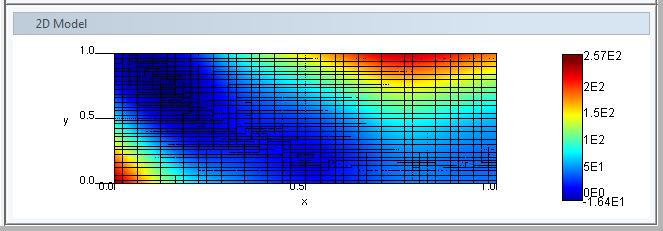
But when i switch my OS to Windows 7, the grid lines are no longer straight... the grid is not displayed properly on Windows 7.

Can anyone help me with this?
Reply | Threaded
Open this post in threaded view
|

Re: jzy3d - improper grid lines on Windows 7 when drawing a shape to a canvas of a chart

gouessej
Administrator
Hi

Are you sure that the difference comes from the OS? Please indicate which hardware you use on both machines.
Julien Gouesse | Personal blog | Website
Reply | Threaded
Open this post in threaded view
|

Re: jzy3d - improper grid lines on Windows 7 when drawing a shape to a canvas of a chart

gem24
This post was updated on .
Hi ,

Yes it can be a hardware issue.
I have windows XP on Desktop PC and Windows 7 on a laptop.
I would check the graphics controllers and let u know the difference.
Also what all information to you need when you say hardware?

Windows XP

Windows 7
Reply | Threaded
Open this post in threaded view
|

Re: jzy3d - improper grid lines on Windows 7 when drawing a shape to a canvas of a chart

gouessej
Administrator
The driver version number would be useful too.
Julien Gouesse | Personal blog | Website