In MeteoInfo software, slice from 3D data is wrapped as a MeshGraphic (
https://github.com/meteoinfo/MeteoInfo/blob/master/meteoinfo-chart/src/main/java/org/meteoinfo/chart/graphic/MeshGraphic.java), and it was rendered using JOGL vbo in MeshRender class (
https://github.com/meteoinfo/MeteoInfo/blob/master/meteoinfo-chart/src/main/java/org/meteoinfo/chart/render/jogl/MeshRender.java). It looks fine without tansparent color:
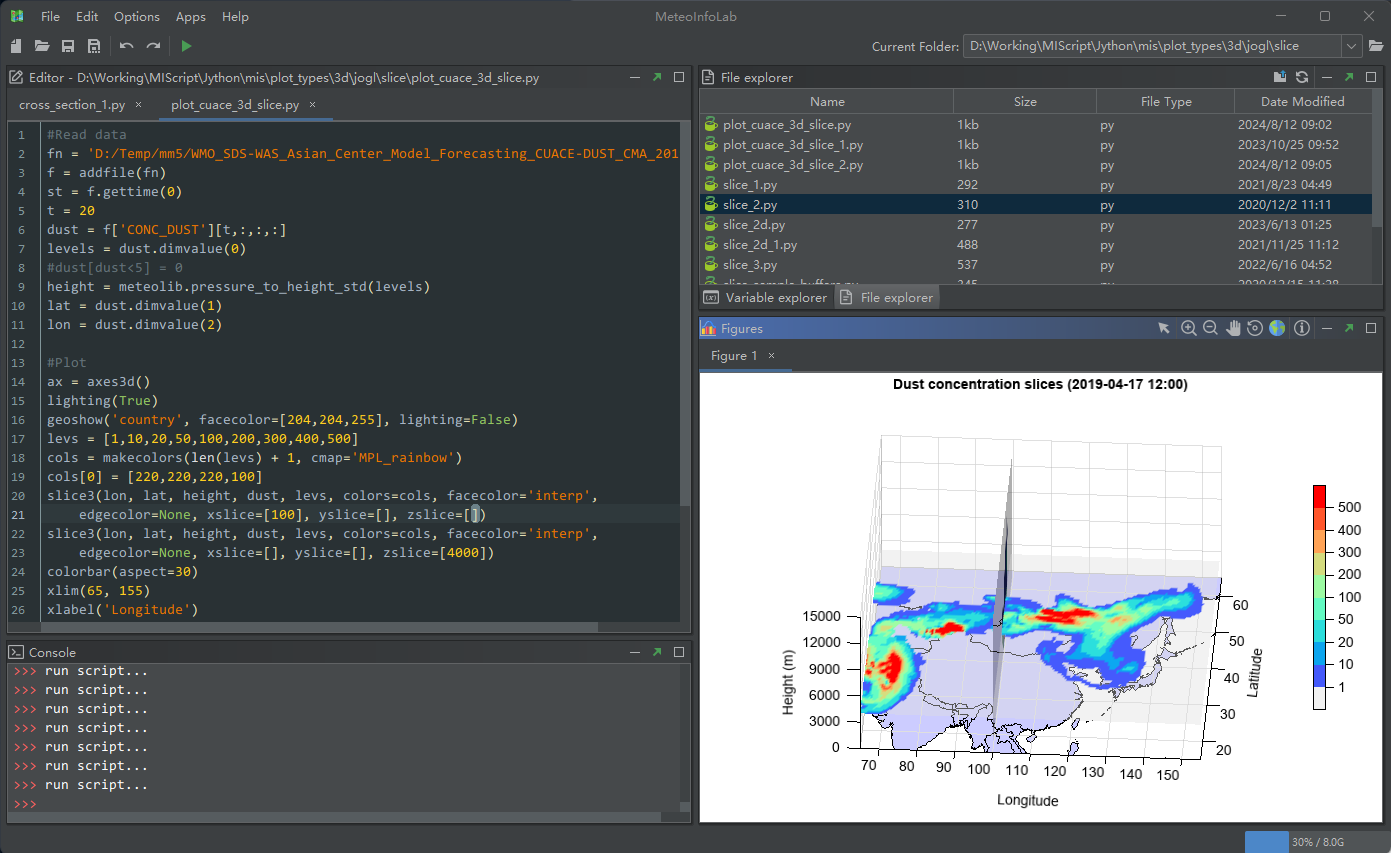
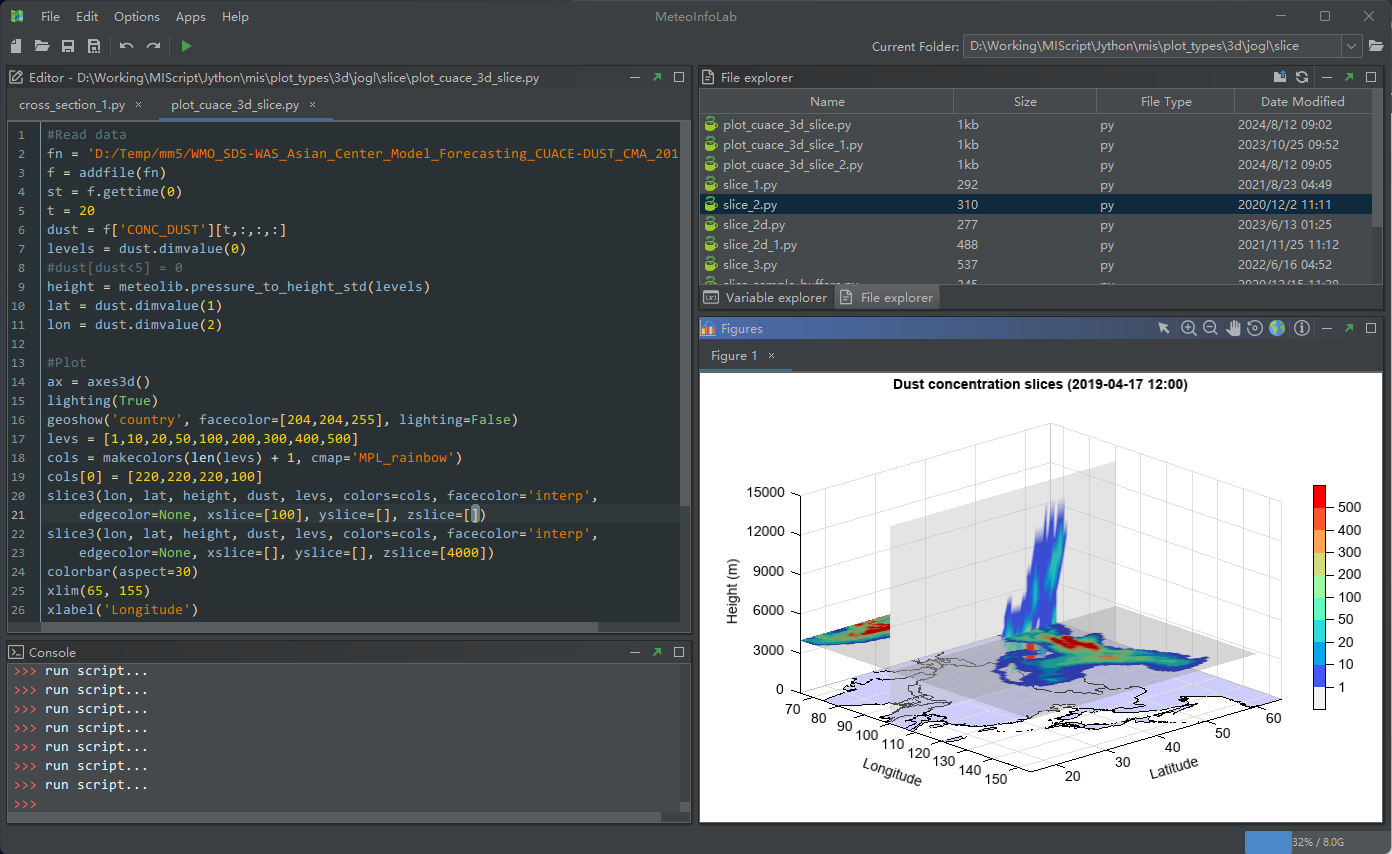
I wanted to visualize sand and dust storm model forecasting data with x and z slices, and the small concentration data was set as transparent color. I found the z slice is obscured by x slice transparent part, while the background surface map could be viewed normally. It is appreciated that anyone can help me to solve this problem.
If the problem need to be reproduced, please find the MeteoInfo:
http://www.meteothink.org/downloads/index.html, and the sand and dust storm data:
http://www.meteothink.org/downloads/data.html. And the following MeteoInfoLab scirpt:
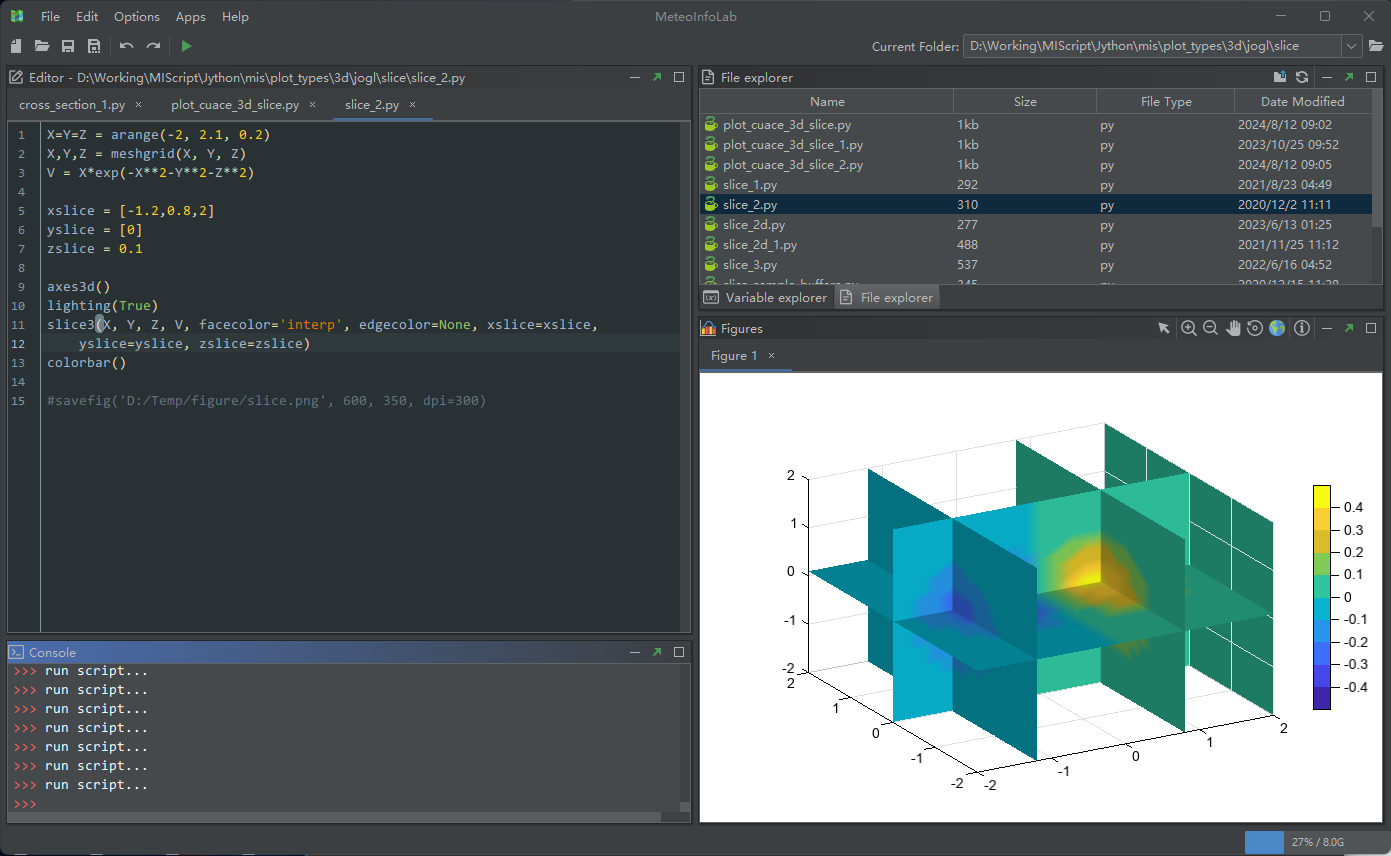
############################# script 1
X=Y=Z = arange(-2, 2.1, 0.2)
X,Y,Z = meshgrid(X, Y, Z)
V = X*exp(-X**2-Y**2-Z**2)
xslice = [-1.2,0.8,2]
yslice = [0]
zslice = 0.1
axes3d()
lighting(True)
slice3(X, Y, Z, V, facecolor='interp', edgecolor=None, xslice=xslice,
yslice=yslice, zslice=zslice)
colorbar()
############################
############################ script 2
#Read data
fn = 'D:/Temp/mm5/WMO_SDS-WAS_Asian_Center_Model_Forecasting_CUACE-DUST_CMA_2019041500.nc'
f = addfile(fn)
st = f.gettime(0)
t = 20
dust = f['CONC_DUST'][t,:,:,:]
levels = dust.dimvalue(0)
#dust[dust<5] = 0
height = meteolib.pressure_to_height_std(levels)
lat = dust.dimvalue(1)
lon = dust.dimvalue(2)
#Plot
ax = axes3d()
lighting(True)
geoshow('country', facecolor=[204,204,255], lighting=False)
levs = [1,10,20,50,100,200,300,400,500]
cols = makecolors(len(levs) + 1, cmap='MPL_rainbow')
cols[0] = [220,220,220,100]
slice3(lon, lat, height, dust, levs, colors=cols, facecolor='interp',
edgecolor=None, xslice=[100], yslice=[], zslice=[])
slice3(lon, lat, height, dust, levs, colors=cols, facecolor='interp',
edgecolor=None, xslice=[], yslice=[], zslice=[4000])
colorbar(aspect=30)
xlim(65, 155)
xlabel('Longitude')
ylim(15, 65)
ylabel('Latitude')
zlim(0, 15000)
zlabel('Height (m)')
tt = st + datetime.timedelta(hours=t*3)
title('Dust concentration slices ({})'.format(tt.strftime('%Y-%m-%d %H:00')))
################################################
www.meteothink.org

