Hi,
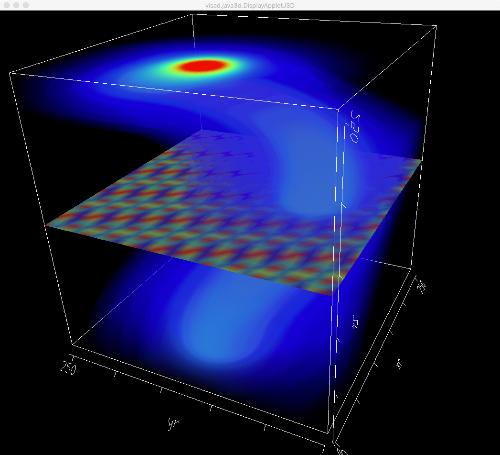
I'm looking for a way to interactively visualize a scalar value with 3D domain, f = f(x,y,z) so that, for example, higher field values are brighter or less transparent, but with the field value -> (color, alpha) user controllable to focus on other features like gradients. One use case would be like a 3D electron probability density surrounding a atom, where the electron cloud would be semi-transparent with a opaque solid object at the center. We have method which I described in a previous post, "render order of children" what we call volume rendering:

but it has some limitations: the underlaying data must be very high resolution, or at least be able to be upscaled, or the rendering looks very blocky. I'm convinced though, if I can resolve the child draw order issue, the texture update capability of Jogamp Ardor3D will be a huge boost to the interactivity.
I've been wondering, and experimenting a little, if the ParticleSystem and Sprites might be used especially in the use case of 3D probability distributions. Is each point like a separate light emitter? The more points per unit volume would make that volume brighter to the eye, and density of points could represent the higher values of the field (probability). Or could there be a single point per unit volume independently mapped to color and alpha so that lower field values would be become more transparent?