Tessellation polygons visulization problem when parallel with z axis
Posted by yaqiang on Aug 10, 2021; 8:24am
URL: https://forum.jogamp.org/Tessellation-polygons-visulization-problem-when-parallel-with-z-axis-tp4041194.html
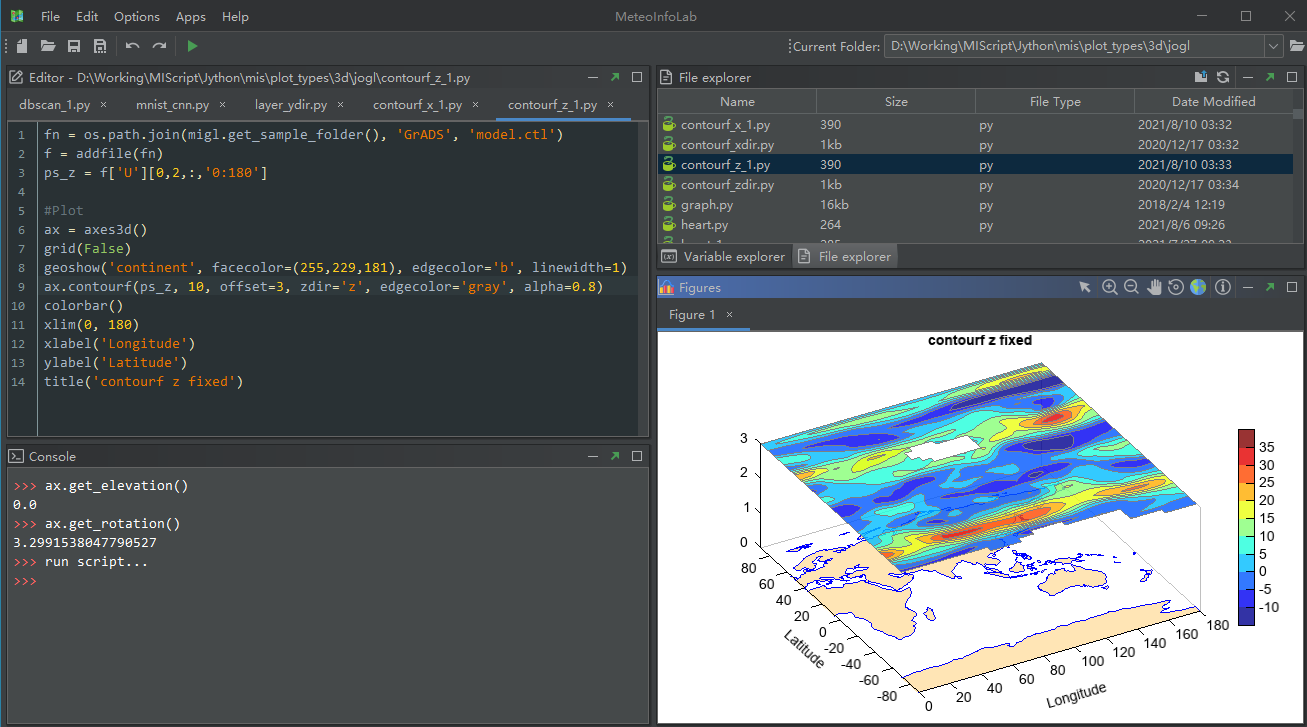
I am developing open source MeteoInfo sotware with 3D plot function powered by JOGL (https://github.com/meteoinfo/MeteoInfo). For 3D contourf function, GLUtessellator was used for polygon tessellation (https://github.com/meteoinfo/MeteoInfo/tree/master/meteoinfo-chart/src/main/java/org/meteoinfo/chart/jogl/tessellator). Every thing is ok when the contour filled polygons perpendicular to z axis, even the polygons with holes.
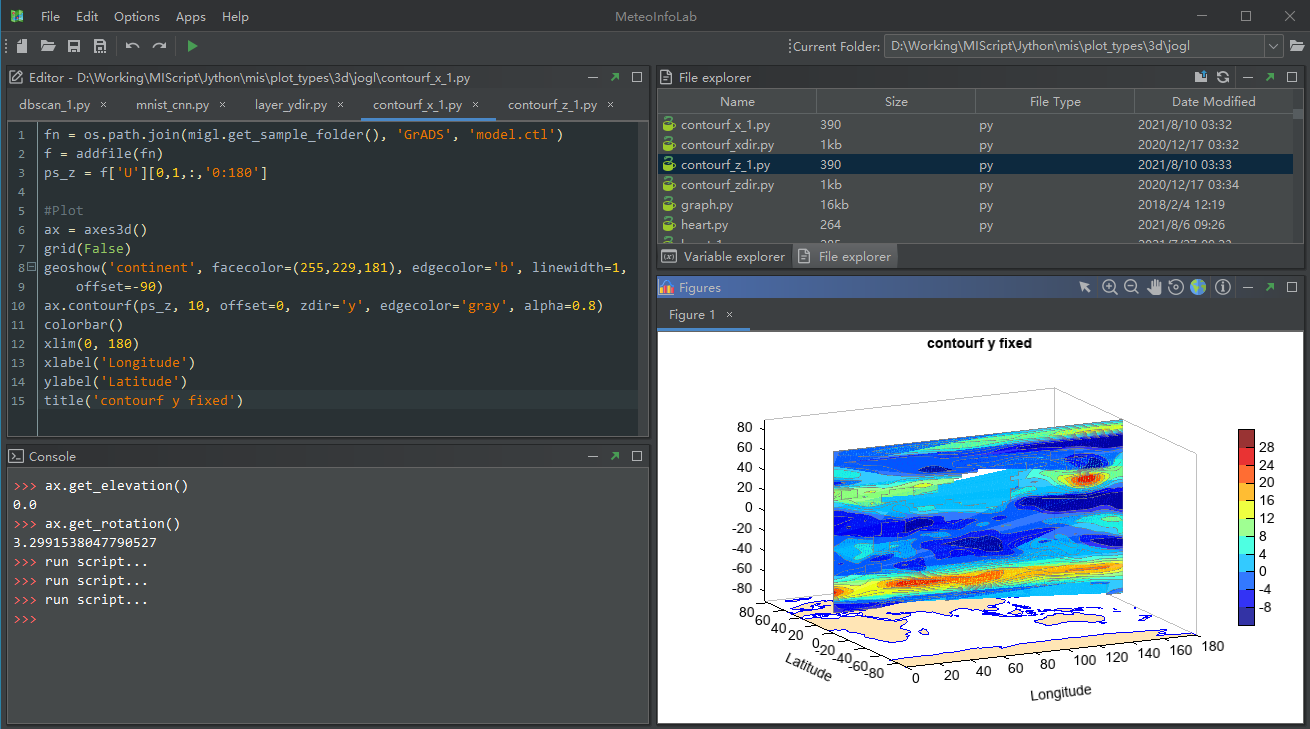
Same polygons with y fixed, so the polygons parallel with z axis, can not be visulized correct.
Any idea on it? Thanks!
The MeteoInfoLab scripts (Jython language) for test:
fn = os.path.join(migl.get_sample_folder(), 'GrADS', 'model.ctl')
f = addfile(fn)
ps_z = f['U'][0,2,:,'0:180']
#Plot
ax = axes3d()
grid(False)
geoshow('continent', facecolor=(255,229,181), edgecolor='b', linewidth=1)
ax.contourf(ps_z, 10, offset=3, zdir='z', edgecolor='gray', alpha=0.8)
colorbar()
xlim(0, 180)
xlabel('Longitude')
ylabel('Latitude')
title('contourf z fixed')
-----------------------------------------------------------------------------------
fn = os.path.join(migl.get_sample_folder(), 'GrADS', 'model.ctl')
f = addfile(fn)
ps_z = f['U'][0,1,:,'0:180']
#Plot
ax = axes3d()
grid(False)
geoshow('continent', facecolor=(255,229,181), edgecolor='b', linewidth=1,
offset=-90)
ax.contourf(ps_z, 10, offset=0, zdir='y', edgecolor='gray', alpha=0.8)
colorbar()
xlim(0, 180)
xlabel('Longitude')
ylabel('Latitude')
title('contourf y fixed')
URL: https://forum.jogamp.org/Tessellation-polygons-visulization-problem-when-parallel-with-z-axis-tp4041194.html
I am developing open source MeteoInfo sotware with 3D plot function powered by JOGL (https://github.com/meteoinfo/MeteoInfo). For 3D contourf function, GLUtessellator was used for polygon tessellation (https://github.com/meteoinfo/MeteoInfo/tree/master/meteoinfo-chart/src/main/java/org/meteoinfo/chart/jogl/tessellator). Every thing is ok when the contour filled polygons perpendicular to z axis, even the polygons with holes.
Same polygons with y fixed, so the polygons parallel with z axis, can not be visulized correct.
Any idea on it? Thanks!
The MeteoInfoLab scripts (Jython language) for test:
fn = os.path.join(migl.get_sample_folder(), 'GrADS', 'model.ctl')
f = addfile(fn)
ps_z = f['U'][0,2,:,'0:180']
#Plot
ax = axes3d()
grid(False)
geoshow('continent', facecolor=(255,229,181), edgecolor='b', linewidth=1)
ax.contourf(ps_z, 10, offset=3, zdir='z', edgecolor='gray', alpha=0.8)
colorbar()
xlim(0, 180)
xlabel('Longitude')
ylabel('Latitude')
title('contourf z fixed')
-----------------------------------------------------------------------------------
fn = os.path.join(migl.get_sample_folder(), 'GrADS', 'model.ctl')
f = addfile(fn)
ps_z = f['U'][0,1,:,'0:180']
#Plot
ax = axes3d()
grid(False)
geoshow('continent', facecolor=(255,229,181), edgecolor='b', linewidth=1,
offset=-90)
ax.contourf(ps_z, 10, offset=0, zdir='y', edgecolor='gray', alpha=0.8)
colorbar()
xlim(0, 180)
xlabel('Longitude')
ylabel('Latitude')
title('contourf y fixed')
www.meteothink.org
| Free forum by Nabble | Edit this page |